- Yssup Rider
- 12-30-2017, 05:36 PM
What the FUCK does that mean, Bambo?
- bambino
- 12-30-2017, 05:41 PM
- dilbert firestorm
- 12-30-2017, 08:39 PM
Looks like WaDA (what a dumb ass) is taking his sweet time coming up with a counter arguement
- Hotrod511
- 12-30-2017, 10:12 PM
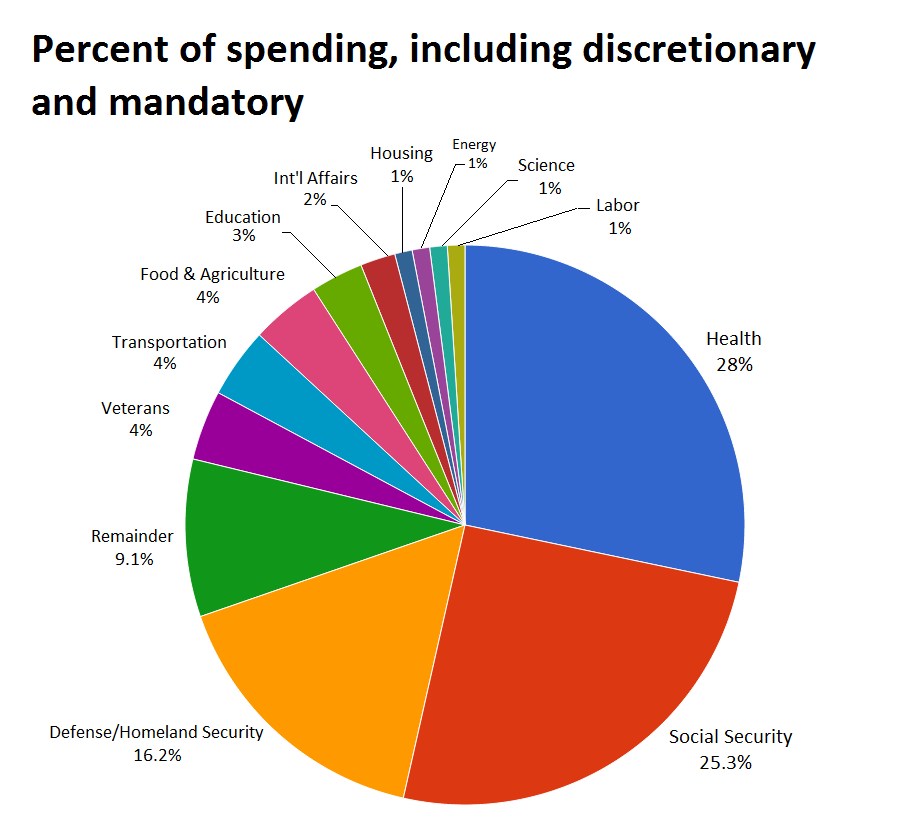
Pie chart of 'federal spending' circulating on the Internet is misleading ...
http://www.politifact.com/truth-o......g-internet-mi/
Claim: Says 57% of federal spending goes to the military and just 1% goes to food and agriculture, including food stamps.
Claimed by: Bloggers
Fact check by PolitiFact: False

WTF
http://www.politifact.com/truth-o......g-internet-mi/
Claim: Says 57% of federal spending goes to the military and just 1% goes to food and agriculture, including food stamps.
Claimed by: Bloggers
Fact check by PolitiFact: False
WTF
- bambino
- 12-30-2017, 10:21 PM
Pie chart of 'federal spending' circulating on the Internet is misleading ...That chart was below the other chart on the link I posted. I believe Dilbert posted the same link. As Trump said about China, SnitchyVI was caught red handed. But his hands are always red trying to beat his limp dick off.
http://www.politifact.com/truth-o......g-internet-mi/
Claim: Says 57% of federal spending goes to the military and just 1% goes to food and agriculture, including food stamps.
Claimed by: Bloggers
Fact check by PolitiFact: False
WTF
- Yssup Rider
- 12-30-2017, 11:08 PM
- Budman
- 12-31-2017, 09:21 AM
You are right, time will tell on Trumps but if history is any indication...I believe you are misrepresenting what this graph shows. This is showing the percentage of revenue / spending against the GNP. Since the taxes were cut and the spending was not cut then obviously the percentage would be less thus showing a greater divide between the two. Below is the total tax revenue per year from 1981 to 2012. https://taxfoundation.org/federal-ta...rce-1934-2018/
Originally Posted by WTF
Fiscal Year Total x 1,000,000.00
1981 $599,272.00
1982 $617,766.00
1983 $600,562.00
1984 $666,438.00
1985 $734,037.00
1986 $769,155.00
1987 $854,288.00
1988 $909,238.00
1989 $991,105.00
1990 $1,031,958.00
1991 $1,054,988.00
1992 $1,091,208.00
1993 $1,154,335.00
1994 $1,258,566.00
1995 $1,351,790.00
1996 $1,453,053.00
1997 $1,579,232.00
1998 $1,721,728.00
1999 $1,827,452.00
2000 $2,025,191.00
2001 $1,991,082.00
2002 $1,853,136.00
2003 $1,782,314.00
2004 $1,880,114.00
2005 $2,153,611.00
2006 $2,406,869.00
2007 $2,567,985.00
2008 $2,523,991.00
2009 $2,104,989.00
2010 $2,162,706.00
2011 $2,303,466.00
2012 $2,450,164.00
- bambino
- 12-31-2017, 10:19 AM
- Yssup Rider
- 12-31-2017, 12:33 PM
The dog chases the tail. But the dog, who is chasing its tail, is smarter? Smarter than the tail? Smarter than itself? Smarter than “is?” I guess that depends on your definition of “is.”
Got it.
hahahahahahahaha!
Got it.
hahahahahahahaha!
- bambino
- 12-31-2017, 12:39 PM
The dog chases the tail. But the dog, who is chasing its tail, is smarter? Smarter than the tail? Smarter than itself? Smarter than is? I guess that depends on your definition of is.The dog chases ITS tail, not THE tail. Got it?
Got it.
hahahahahahahaha! Originally Posted by Yssup Rider
HaHaHaHaHaHaHa
- WTF
- 12-31-2017, 12:52 PM
Looks like WaDA (what a dumb ass) is taking his sweet time coming up with a counter arguement Originally Posted by dilbert firestormSorry dilbert, haven busy.
Pie chart of 'federal spending' circulating on the Internet is misleading ...Many of you need to learn the difference between discretionary and mandatory budgets.
www.politifact.com/truth-o.../pie-chart-federal-spending-circulating-internet-mi/
Claim: Says 57% of federal spending goes to the military and just 1% goes to food and agriculture, including food stamps.
Claimed by: Bloggers
Fact check by PolitiFact: False
WTF
If you were to do so , you'd quit making fools of yourself.
- WTF
- 12-31-2017, 01:00 PM
Except that the current debt was accumulated by discretionary spending. Of which the military is responsible for around 65% of. Or 12. 38 Trillion dollars.
A proper analysis would go something like this - the national debt has gone up by $19 trillion since 1980. Defense outlays have accounted for 15% of total federal spending over the same period. Ergo, 15% of the growth in the national debt (less than $3 trillion) is attributable to defense spending.
But that approach would be too rational for snitchy. He wants to whip up anti-military fervor, so he heaps 100% of the debt problem on 15% of the budget.
. Originally Posted by lustylad
The entitlements programs so far have added nothing to the national debt as they are fully funded.
bambino is correct future outlays will not be enough in our current payroll tax system and they need adjustments.
That does nothing to fix the current problem of discretionary spending.
Like I said, many of you need to brush up on the difference between discretionary spending and entitlement spending.
To date entitlement inflow have made the discretionary spending seem like it is a smaller problem than it is because of their SURPLUS.
- bambino
- 12-31-2017, 01:23 PM
Except that the current debt was accumulated by discretionary spending. Of which the military is responsible for around 65% of. Or 12. 38 Trillion dollars.Read this numbuts. Entitlement spending has accounted for more of our debt than the military. Its just a fact.
The entitlements programs so far have added nothing to the national debt as they are fully funded.
bambino is correct future outlays will not be enough in our current payroll tax system and they need adjustments.
That does nothing to fix the current problem of discretionary spending.
Like I said, many of you need to brush up on the difference between discretionary spending and entitlement spending.
To date entitlement inflow have made the discretionary spending seem like it is a smaller problem than it is because of their SURPLUS. Originally Posted by WTF
http://www.politifact.com/florida/st...nse-are-drivi/
Read post #73 as well. Entitlements have contribute more than double to our debt than the military and will obviously get worse. They have to reform our entitlement system. Period. Can congress cut military spending? Sure. Its up to them.
- dilbert firestorm
- 12-31-2017, 02:21 PM
Pie chart of 'federal spending' circulating on the Internet is misleading ...your politifact link is broken. here's the correct link.
www.politifact.com/truth-o.../pie-chart-federal-spending-circulating-internet-mi/
Claim: Says 57% of federal spending goes to the military and just 1% goes to food and agriculture, including food stamps.
Claimed by: Bloggers
Fact check by PolitiFact: False
WTF
http://www.politifact.com/truth-o-me...g-internet-mi/
btw, what year is that pie chart from?
- dilbert firestorm
- 12-31-2017, 02:35 PM
your politifact link is broken. here's the correct link.never mind., its based on the 2015 data according to politifact.
http://www.politifact.com/truth-o-me...g-internet-mi/
btw, what year is that pie chart from? Originally Posted by dilbert firestorm