How are we going to pay for all this shit?

WTF's Avatar
  • WTF
  • 12-08-2021, 06:33 AM
And let me give you a friendly reminder... youz iz wrong. so crack yer stubby old knuckles and type more bullshit. it will still be bullshit. now and 100 years from now.


BAHHHAAAA Originally Posted by The_Waco_Kid
I'm not wrong....the numbers don't lie.

They prove people like you and LL haven't a clue as to wtf you keep parroting.

I have contended for a long long time Reagan started this debt be damned. I've provided his economic guru's stating as much. But those are just words. The numbers prove the words are in fact true.

You seem not to have a clue about the actual results. What are the numbers? I've provided them. All LL and now you have done is disparage the messenger because you can not dispute the numbers

Hopefully Tiny will reenter the conversation...he is at least honest in his communication. This supply side myth has been blown out of the water by Stockman.
WTF's Avatar
  • WTF
  • 12-08-2021, 07:03 AM
1929 $17 16% Market crash
1930 $16 17% Smoot-Hawley reduced trade
1931 $17 22% Dust Bowl drought raged
1932 $20 34% Hoover raised taxes
1933 $23 40% New Deal increased GDP & debt
1934 $27 40%
1935 $29 39% Social Security
1936 $34 40% Tax hikes renewed depression
1937 $36 39% Third New Deal
1938 $37 42% Dust Bowl ended
1939 $40 51% Depression ended
1940 $43 49% FDR increased spending & raised taxes
1941 $49 44% U.S. entered WWII
1942 $72 48% Defense tripled
1943 $137 70%
1944 $201 91% Bretton Woods
1945 $259 114% WWII ended
1946 $269 119% Truman's 1st term budgets & recession
1947 $258 103% Cold War
1948 $252 92% Recession
1949 $253 93% Recession
1950 $257 86% Korean War boosted growth and debt
1951 $255 74%
1952 $259 71%
1953 $266 68% Recession when war ended
1954 $271 69% Eisenhower's budgets & Recession
1955 $274 64%
1956 $273 61%
1957 $271 57% Recession
1958 $276 58% Eisenhower's 2nd term & recession
1959 $285 55% Fed raised rates
1960 $286 54% Recession
1961 $289 52% Bay of Pigs
1962 $298 50% JFK budgets & Cuban missile crisis
1963 $306 48% U.S. aids Vietnam, JFK killed
1964 $312 46% LBJ's budgets & war on poverty
1965 $317 43% U.S. entered Vietnam War
1966 $320 40% 1967 $326 40%
1968 $348 39%
1969 $354 36% Nixon took office
1970 $371 35% Recession
1971 $398 35% Wage-price controls
1972 $427 34% Stagflation
1973 $458 33% Nixon ended gold standard & OPEC oil embargo
1974 $475 31% Watergate & budget process created
1975 $533 32% Vietnam War ended
1976 $620 33% Stagflation
1977 $699 34% Stagflation
1978 $772 33% Carter budgets & recession
1979 $82732%
1980 $908 32% Volcker raised fed rate to 20%
1981 $998 31% Reagan tax cut
1982 $1,142 34% Reagan increased spending
1983 $1,377 37% Jobless rate 10.8%
1984 $1,572 38% Increased defense spending
1985 $1,823 41%
1986 $2,125 46% Reagan lowered taxes
1987 $2,350 48% Market crash
1988 $2,602 50% Fed raised rates
1989 $2,857 51% S&L Crisis
1990 $3,233 54% First Iraq War
1991 $3,665 58% Recession
1992 $4,065 61%
1993 $4,411 63% Omnibus Budget Act
1994 $4,693 64% Clinton budgets
1995 $4,974 64%
1996 $5,225 64% Welfare reform
1997 $5,413 63%
1998 $5,526 60% LTCM crisis & recession
1999 $5,656 58% Glass-Steagall repealed
2000 $5,674 55% Budget surplus
2001 $5,807 55% 9/11 attacks & EGTRRA
2002 $6,228 57% War on Terror
2003 $6,783 59% JGTRRA & Iraq War
2004 $7,379 60% Iraq War
2005 $7,933 61% Bankruptcy Act & Katrina.
2006 $8,507 61% Bernanke chaired Fed
2007 $9,008 62% Bank crisis
2008 $10,025 68% Bank bailout & QE
2009 $11,910 82% Bailout cost $250B ARRA added $242B
2010 $13,562 90% ARRA added $400B, payroll tax holiday ended, Obama Tax cuts, ACA, Simpson-Bowles
2011 $14,790 95% Debt crisis, recession and tax cuts reduced revenue
2012 $16,066 99% Fiscal cliff
2013 $16,738 99% Sequester, government shutdown
2014 $17,824 101% QE ended, debt ceiling crisis
2015 $18,151 100% Oil prices fell
2016 $19,573 105% Brexit
2017 $20,245 104% Congress raised the debt ceiling
2018 $21,516 105% Trump tax cuts
2019 $22,719 107% Trade wars
2020 $27,748 129% COVID-19 & 2020 recession
2021 $28,400 125% COVID-19 & American Rescue Plan Act
lustylad's Avatar
I'm not wrong....the numbers don't lie...

You seem not to have a clue about the actual results. What are the numbers? I've provided them. All LL and now you have done is disparage the messenger because you can not dispute the numbers

Hopefully Tiny will reenter the conversation...he is at least honest in his communication. Originally Posted by WTF
Tiny's not going to bail you out. He already weighed in and told you (politely) that you're full of shit:

The federal debt, net of government holdings, was around 40% (of GDP) at the end of the Reagan Administration. That's a pretty healthy level. Originally Posted by Tiny
You're the clown who is lying about the numbers in a silly, desperate effort to make Reagan look bad.

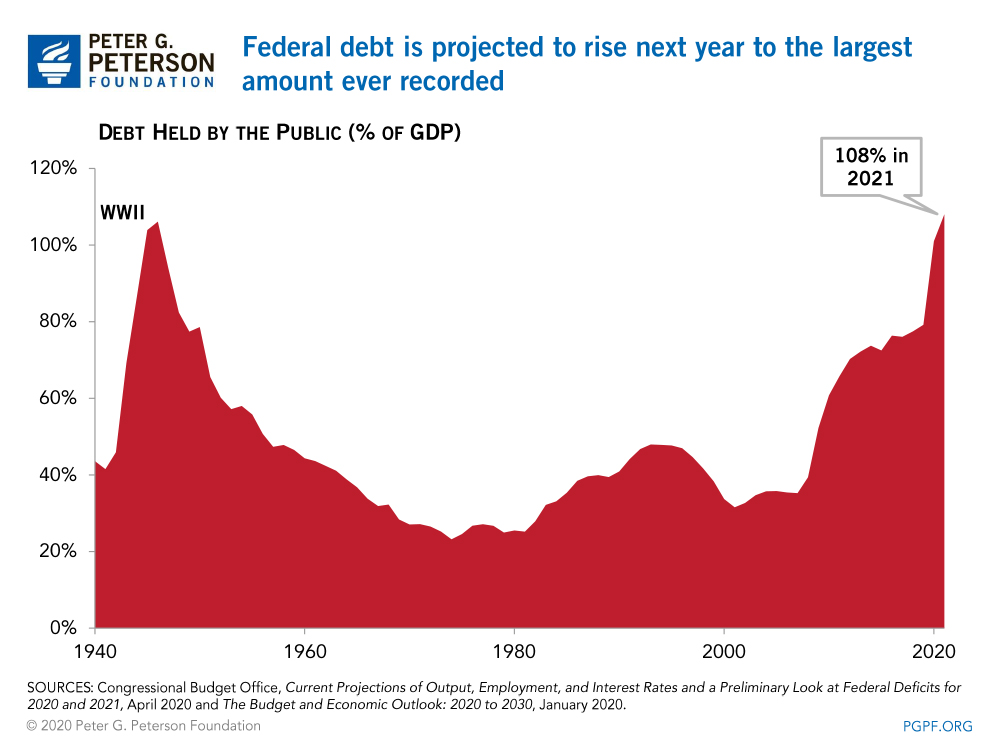
Here's the fucking graph again. Where does the curve shoot up the most steeply? Under FDR, Obama, and after the pandemic hit. Reagan's tenure is a modest bump that barely registers compared to those 3 dramatic spikes.


You're like the guy who points to a picture of a lion, insists it's a pig, and calls everyone who laughs and makes fun of his obvious visual impairment a liar.
WTF's Avatar
  • WTF
  • 12-08-2021, 12:59 PM
Originally Posted by Tiny View Post
The federal debt, net of government holdings, was around 40% (of GDP) at the end of the Reagan Administration. That's a pretty healthy level

1988 $2,602 50%
https://www.thebalance.com/national-...events-3306287

Maybe Tiny can explain the discrepancy between this link showing that ratio to be 50% in 1988, not 40%. After you two figure that out....get back with me and we can discuss why you consider Reagan's time on the graph as a "modest bump"?
WTF's Avatar
  • WTF
  • 12-08-2021, 02:04 PM
And both you (LL) and TheWackoKid better hope CM does not start posting his view about David Stockman.

Tiny may change his mind about your economic prowess.
eccieuser9500's Avatar
Where are the numbers on the money side?


Just instigating.
The_Waco_Kid's Avatar
And both you (LL) and TheWackoKid better hope CM does not start posting his view about David Stockman.

Tiny may change his mind about your economic prowess. Originally Posted by WTF

you certainly haven't changed my mind about yours


BAHHAHAAAAA
WTF's Avatar
  • WTF
  • 12-09-2021, 05:16 AM
you certainly haven't changed my mind about yours


BAHHAHAAAAA Originally Posted by The_Waco_Kid
That's the first I heard you have a brain.

You'll notice that lustylad does not answer the discrepancy question. Well a Scarecrow like you may not have noticed. You're still waiting to see the Wizard I bet.


How's your stock gains btw?
  • Tiny
  • 12-09-2021, 12:26 PM
Maybe Tiny can explain the discrepancy between this link showing that ratio to be 50% in 1988, not 40%. After you two figure that out....get back with me and we can discuss why you consider Reagan's time on the graph as a "modest bump"? Originally Posted by WTF
I suspect the 50% number is gross federal debt as a % of GDP, which includes government debt held by the Fed, social security trust funds, etc., but I didn’t check that out. The 40%, which is the one to look at, is federal debt held by the public as a % of GDP
.
I'm not wrong....the numbers don't lie.

They prove people like you and LL haven't a clue as to wtf you keep parroting.

I have contended for a long long time Reagan started this debt be damned. I've provided his economic guru's stating as much. But those are just words. The numbers prove the words are in fact true.

You seem not to have a clue about the actual results. What are the numbers? I've provided them. All LL and now you have done is disparage the messenger because you can not dispute the numbers

Hopefully Tiny will reenter the conversation...he is at least honest in his communication. This supply side myth has been blown out of the water by Stockman. Originally Posted by WTF
I just don’t see that WTF. Looking at debt as a % of GDP across countries and time periods, 40% isn’t that out of line. You and I agree that historically too much money has been spent on the military. But LustyLad presented a very compelling argument that the military build up that accompanied the increase in the debt under Reagan was worth the cost, given it ended the cold war.

And both you (LL) and TheWackoKid better hope CM does not start posting his view about David Stockman.

Tiny may change his mind about your economic prowess. Originally Posted by WTF
Nope, not a chance. Arguing economics with LustyLad is masochism. I did it on free trade once, and even though I still suspect I might have been right, he kicked my ass from here to Timbuktu. I might stand a chance if I took a few graduate level classes in economics but since that’s not going to happen I just gave up.

I learned a few things from his posts in this thread the last few days btw, which surfaced in the back and forth with you, about what created the national debt. And you both provided more queer and trannie insults than I’ll be able to use in a lifetime. If they put you and LustyLad on something like the old Crossfire on CNN, they’d sell a butt load of commercials. It'd be more entertaining than anything on cable news.
WTF's Avatar
  • WTF
  • 12-09-2021, 01:17 PM
I suspect the 50% number is gross federal debt as a % of GDP, which includes government debt held by the Fed, social security trust funds, etc., but I didn’t check that out. The 40%, which is the one to look at, is federal debt held by the public as a % of GDP
.
. Originally Posted by Tiny
I promise I will answer all your replies but one at a time as will be easier and a ton more fun!

I'll start out saying I suspect you are correct in the 50% being the gross.

My question is why do you choose that number 40% over the 50%? Are you of the opinion that SS does not have to be paid back?

If lustylad owed the bank and say his boyfriend, do you think his tranny boyfriend would appreciate not be labeled a liability who is making lustylad credit score appear better than it really is because LL didn't list his boyfriend's debt?

Omg...I'm going to have so much fun with the next paragraph....and the next.
WTF's Avatar
  • WTF
  • 12-09-2021, 01:35 PM
.


I just don’t see that WTF. Looking at debt as a % of GDP across countries and time periods, 40% isn’t that out of line. You and I agree that historically too much money has been spent on the military. But LustyLad presented a very compelling argument that the military build up that accompanied the increase in the debt under Reagan was worth the cost, given it ended the cold war. Originally Posted by Tiny
We disagree on the real ratio...I say it is 50%. But we will debate that on the other post.

Jeffery Dommer presented a compelling argument on why one should join him for lunch compelling does not equate to truthful.

One could argue that the elongated low price of oil had as much to do if not more than keeping up with the Americans. In fact Afganistan could be the black hole and Jimmy Carter started funding the opposition, with Charlie Wilson grabbing that torch ahead of Reagan.

Also did it really end the Cold War. Did Russia stay like a Germany or Japan? I would argue not.

Was the so called Peace dividend not used against the Democrats?

Was Reagan's debt not a precursor to more and more debt? Graph the gross ratio and see the elevated incline.

In fact one could argue that Senior Bush's defeat was a direct result of Reagan's idiotic preaching that tax increases were antiAmercian. Bush went from record high polling to defeat.

I could even argue that Clinton's deficit reduction numbers were a combination of the Bush tax hike, the Reagan tax hike to SS , the stock bubble along with the slow down in defense spending and welfare.

Whereas our wannabe economist (LL) seems to think everything from the fall of the Soviets to Disco is all because of Ronnie.
bambino's Avatar
NEW!

President Donald J. Trump:

“Mitch McConnell just folded on the Debt Ceiling, a total victory for the Democrats—didn’t use it to kill the $5 Trillion Dollar (real number!) Build Back Worse Bill that will essentially change the fabric of our Country forever. The Old Crow’s two-month extension, and the break up of the Bill into two parts, gave the Democrats everything they needed. The Dems would have folded completely if Mitch properly played his hand, and if not, the Debt Ceiling scenario would be far less destructive than the Bill that will get passed. He has all the cards to win, but not the “guts” to play them. Instead, he gives our Country away, just like he did with the two Senate seats in Georgia, and the Presidency itself. The Old Crow is a disaster!”

@LizHarrington76
WTF's Avatar
  • WTF
  • 12-09-2021, 03:54 PM
list his boyfriend's debt?
Originally Posted by WTF
My apologies to lustylad...that should be ...list his debts that he owes his boyfriend.

Tiny I can hardly wait and see if we are were right about it being gross vs private. And if he is as bright as you say he is...there should be a perfectly good reason why one may be a better gauge than the other for our purposes.
The_Waco_Kid's Avatar
1929 $17 16% Market crash
1930 $16 17% Smoot-Hawley reduced trade
1931 $17 22% Dust Bowl drought raged
1932 $20 34% Hoover raised taxes
1933 $23 40% New Deal increased GDP & debt
1934 $27 40%
1935 $29 39% Social Security
1936 $34 40% Tax hikes renewed depression
1937 $36 39% Third New Deal
1938 $37 42% Dust Bowl ended
1939 $40 51% Depression ended
1940 $43 49% FDR increased spending & raised taxes
1941 $49 44% U.S. entered WWII
1942 $72 48% Defense tripled
1943 $137 70%
1944 $201 91% Bretton Woods
1945 $259 114% WWII ended
1946 $269 119% Truman's 1st term budgets & recession
1947 $258 103% Cold War
1948 $252 92% Recession
1949 $253 93% Recession
1950 $257 86% Korean War boosted growth and debt
1951 $255 74%
1952 $259 71%
1953 $266 68% Recession when war ended
1954 $271 69% Eisenhower's budgets & Recession
1955 $274 64%
1956 $273 61%
1957 $271 57% Recession
1958 $276 58% Eisenhower's 2nd term & recession
1959 $285 55% Fed raised rates
1960 $286 54% Recession
1961 $289 52% Bay of Pigs
1962 $298 50% JFK budgets & Cuban missile crisis
1963 $306 48% U.S. aids Vietnam, JFK killed
1964 $312 46% LBJ's budgets & war on poverty
1965 $317 43% U.S. entered Vietnam War
1966 $320 40% 1967 $326 40%
1968 $348 39%
1969 $354 36% Nixon took office
1970 $371 35% Recession
1971 $398 35% Wage-price controls
1972 $427 34% Stagflation
1973 $458 33% Nixon ended gold standard & OPEC oil embargo
1974 $475 31% Watergate & budget process created
1975 $533 32% Vietnam War ended
1976 $620 33% Stagflation
1977 $699 34% Stagflation
1978 $772 33% Carter budgets & recession
1979 $82732%
1980 $908 32% Volcker raised fed rate to 20%
1981 $998 31% Reagan tax cut
1982 $1,142 34% Reagan increased spending
1983 $1,377 37% Jobless rate 10.8%
1984 $1,572 38% Increased defense spending
1985 $1,823 41%
1986 $2,125 46% Reagan lowered taxes
1987 $2,350 48% Market crash
1988 $2,602 50% Fed raised rates
1989 $2,857 51% S&L Crisis
1990 $3,233 54% First Iraq War
1991 $3,665 58% Recession
1992 $4,065 61%
1993 $4,411 63% Omnibus Budget Act
1994 $4,693 64% Clinton budgets
1995 $4,974 64%
1996 $5,225 64% Welfare reform
1997 $5,413 63%
1998 $5,526 60% LTCM crisis & recession
1999 $5,656 58% Glass-Steagall repealed
2000 $5,674 55% Budget surplus
2001 $5,807 55% 9/11 attacks & EGTRRA
2002 $6,228 57% War on Terror
2003 $6,783 59% JGTRRA & Iraq War
2004 $7,379 60% Iraq War
2005 $7,933 61% Bankruptcy Act & Katrina.
2006 $8,507 61% Bernanke chaired Fed
2007 $9,008 62% Bank crisis
2008 $10,025 68% Bank bailout & QE
2009 $11,910 82% Bailout cost $250B ARRA added $242B
2010 $13,562 90% ARRA added $400B, payroll tax holiday ended, Obama Tax cuts, ACA, Simpson-Bowles
2011 $14,790 95% Debt crisis, recession and tax cuts reduced revenue
2012 $16,066 99% Fiscal cliff
2013 $16,738 99% Sequester, government shutdown
2014 $17,824 101% QE ended, debt ceiling crisis
2015 $18,151 100% Oil prices fell
2016 $19,573 105% Brexit
2017 $20,245 104% Congress raised the debt ceiling
2018 $21,516 105% Trump tax cuts
2019 $22,719 107% Trade wars
2020 $27,748 129% COVID-19 & 2020 recession
2021 $28,400 125% COVID-19 & American Rescue Plan Act Originally Posted by WTF

no not again. your original post started at 1980. i'm the one that first posted the full list ..

and professor .. guess what the 1980 line item shows ..


1980 $908 32% Volcker raised fed rate to 20%


in a later post in this thread you blamed Reagan for the debt during his terms and after .. completely disingenuous bullshit.

unless you want to also blame all the presidents prior to Reagan.

so by your logic professor ...

Hoover
FDR
Truman
Eisenhower
JFK
LBJ
tricky Dick
Ford
Carter

are guilty of the 908 billion debt up to Reagan. right, professor????


in reality .. every president from Hoover to Biden are all responsible for the debt.
WTF's Avatar
  • WTF
  • 12-09-2021, 07:34 PM
no not again. your original post started at 1980. i'm the one that first posted the full list ..

and professor .. guess what the 1980 line item shows ..


1980 $908 32% Volcker raised fed rate to 20%


in a later post in this thread you blamed Reagan for the debt during his terms and after .. completely disingenuous bullshit.

unless you want to also blame all the presidents prior to Reagan.

so by your logic professor ...

Hoover
FDR
Truman
Eisenhower
JFK
LBJ
tricky Dick
Ford
Carter

are guilty of the 908 billion debt up to Reagan. right, professor????


in reality .. every president from Hoover to Biden are all responsible for the debt. Originally Posted by The_Waco_Kid
You really are slow...I've already answered you.

The ratio
had been slowly going down.

That is the focus Grasshopper and Reagan was the one who jumped started it (the ratio) going back up. I would provide a graph for you but I think it would just confuse further!

From a high of 119% in 1946 to 32% and then old Ronnie Pooh had it back up to 50%.

But myself and Tiny are waiting to hear from the forums own self professed genius....if you thought that was you, my apologies but jackass is close enough here!

It is too late to sit down before you embarrass yourself but it's not too late to stfu