Maybe Tiny can explain the discrepancy between this link showing that ratio to be 50% in 1988, not 40%. After you two figure that out....get back with me and we can discuss why you consider Reagan's time on the graph as a "modest bump"?
Originally Posted by WTF
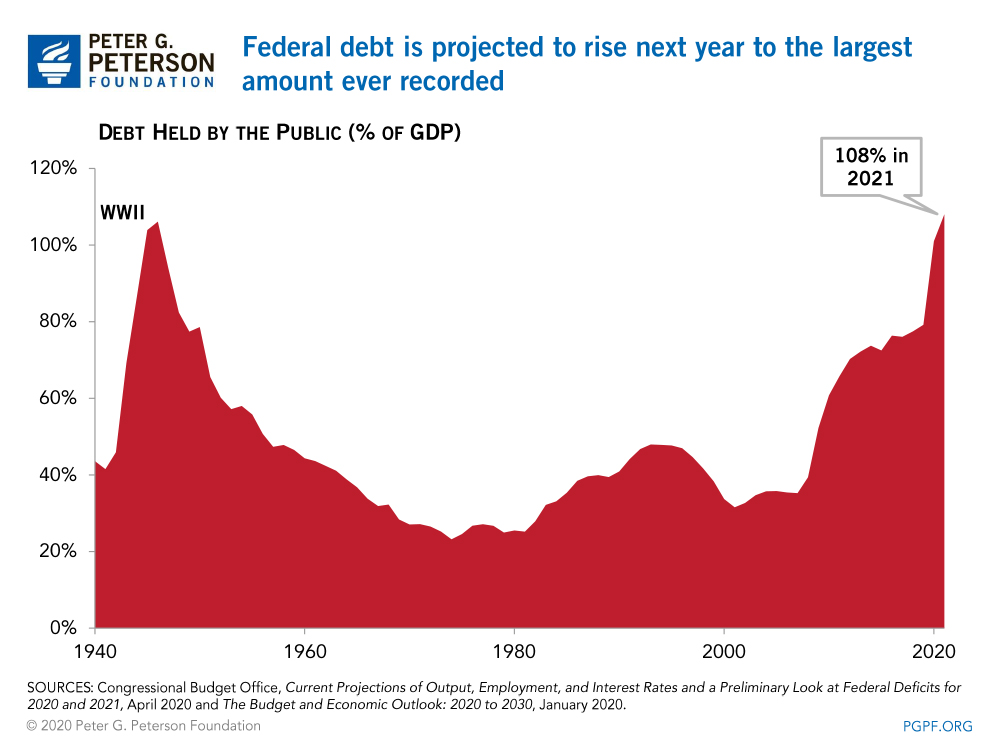
I suspect the 50% number is gross federal debt as a % of GDP, which includes government debt held by the Fed, social security trust funds, etc., but I didn’t check that out. The 40%, which is the one to look at, is federal debt held by the public as a % of GDP
.
I'm not wrong....the numbers don't lie.
They prove people like you and LL haven't a clue as to wtf you keep parroting.
I have contended for a long long time Reagan started this debt be damned. I've provided his economic guru's stating as much. But those are just words. The numbers prove the words are in fact true.
You seem not to have a clue about the actual results. What are the numbers? I've provided them. All LL and now you have done is disparage the messenger because you can not dispute the numbers
Hopefully Tiny will reenter the conversation...he is at least honest in his communication. This supply side myth has been blown out of the water by Stockman.
Originally Posted by WTF
I just don’t see that WTF. Looking at debt as a % of GDP across countries and time periods, 40% isn’t that out of line. You and I agree that historically too much money has been spent on the military. But LustyLad presented a very compelling argument that the military build up that accompanied the increase in the debt under Reagan was worth the cost, given it ended the cold war.
And both you (LL) and TheWackoKid better hope CM does not start posting his view about David Stockman.
Tiny may change his mind about your economic prowess.
Originally Posted by WTF
Nope, not a chance. Arguing economics with LustyLad is masochism. I did it on free trade once, and even though I still suspect I might have been right, he kicked my ass from here to Timbuktu. I might stand a chance if I took a few graduate level classes in economics but since that’s not going to happen I just gave up.
I learned a few things from his posts in this thread the last few days btw, which surfaced in the back and forth with you, about what created the national debt. And you both provided more queer and trannie insults than I’ll be able to use in a lifetime. If they put you and LustyLad on something like the old Crossfire on CNN, they’d sell a butt load of commercials. It'd be more entertaining than anything on cable news.