I think much more information is needed to jump to your conclusion, Chuck. What's the sample size of the participants in this poll? What are their education and income status? What states do they live in? Those are just a few basic questions to validate your extreme conclusion.
I specifically mention state residency as a question because of the simple fact that red states such as Arkansas or Alabama do not share the same views as blue states like California or New York to validate what I believe to be your highly flawed conclusion about racism (or lack thereof) considering the ambiguity regarding the backgrounds of the poll participants.
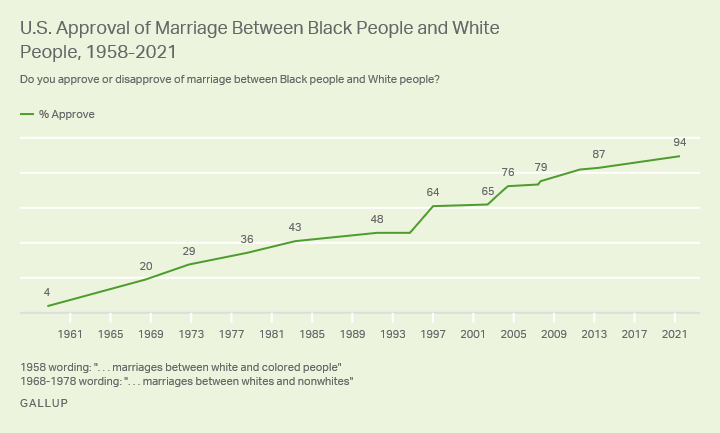
Originally Posted by Lucas McCain
McCain, A Gallup article on the poll is an interesting read and addresses a couple of your points,
https://news.gallup.com/poll/354638/...-new-high.aspx
Ninety-one percent of people over the age of 50 approve of interracial marriage. And 93% in the South approve.
As to survey methods,
Results for this Gallup poll are based on telephone interviews conducted July 6-21, 2021, with a random sample of 1,007 adults, aged 18 and older, living in all 50 U.S. states and the District of Columbia. For results based on the total sample of national adults, the margin of sampling error is ±4 percentage points at the 95% confidence level. All reported margins of sampling error include computed design effects for weighting.
Each sample of national adults includes a minimum quota of 70% cellphone respondents and 30% landline respondents, with additional minimum quotas by time zone within region. Landline and cellular telephone numbers are selected using random-digit-dial methods.
The fact that Gallup has done the same poll thirteen times since 1969, and the trend through the years is clearly towards higher approval levels, would make me believe the numbers are reasonable.
Gallup provides links to additional polls that support RINO Charlie's thesis that America is much less racist than it used to be. Here's what they say about that,
A similar gradual change can be seen in willingness to vote for a Black presidential candidate, a trend that spans just as much time as Gallup's trend on interracial marriage. While voting for a Black candidate was unpopular in the 1950s, nearly all Americans say they would be willing to do so today. Americans' ideas about marriage, too, have changed. Solid majorities now support same-sex marriage, and larger majorities than in the past view divorce as morally acceptable.
At the same time, Americans have become less likely to say that civil rights for Black Americans have improved, and they have recently become more likely to say that new civil rights laws are needed to reduce discrimination against Black people.
I thought results of the "who would you vote for president" poll were interesting. Here are the results, from 2019, being the percentage of Americans who would vote for a generally-qualified person for president who fell into the following categories,
Black 96%
Catholic 95%
Hispanic 95%
A woman 94%
Jewish 93%
Evangelical Christian 80%
Gay or Lesbian 76%
Under the Age of 40 71%
Muslim 66%
Over the age of 70 63% (Democrats and Republicans take note)
An atheist 60%
A socialist 47%
https://news.gallup.com/poll/254120/...president.aspx
Well, I may be close minded, but I damn well wouldn't vote for a socialist. Any of the rest are pretty much OK in my mind, as long as the candidate believes in free markets, the rule of law, and small government.